Flint: A Semantic-driven Data Visualization Intermediate Language
Yunhai Wang, Kecheng Lu, Junhao Chen, Alper Sarikaya, Chenglong Wang
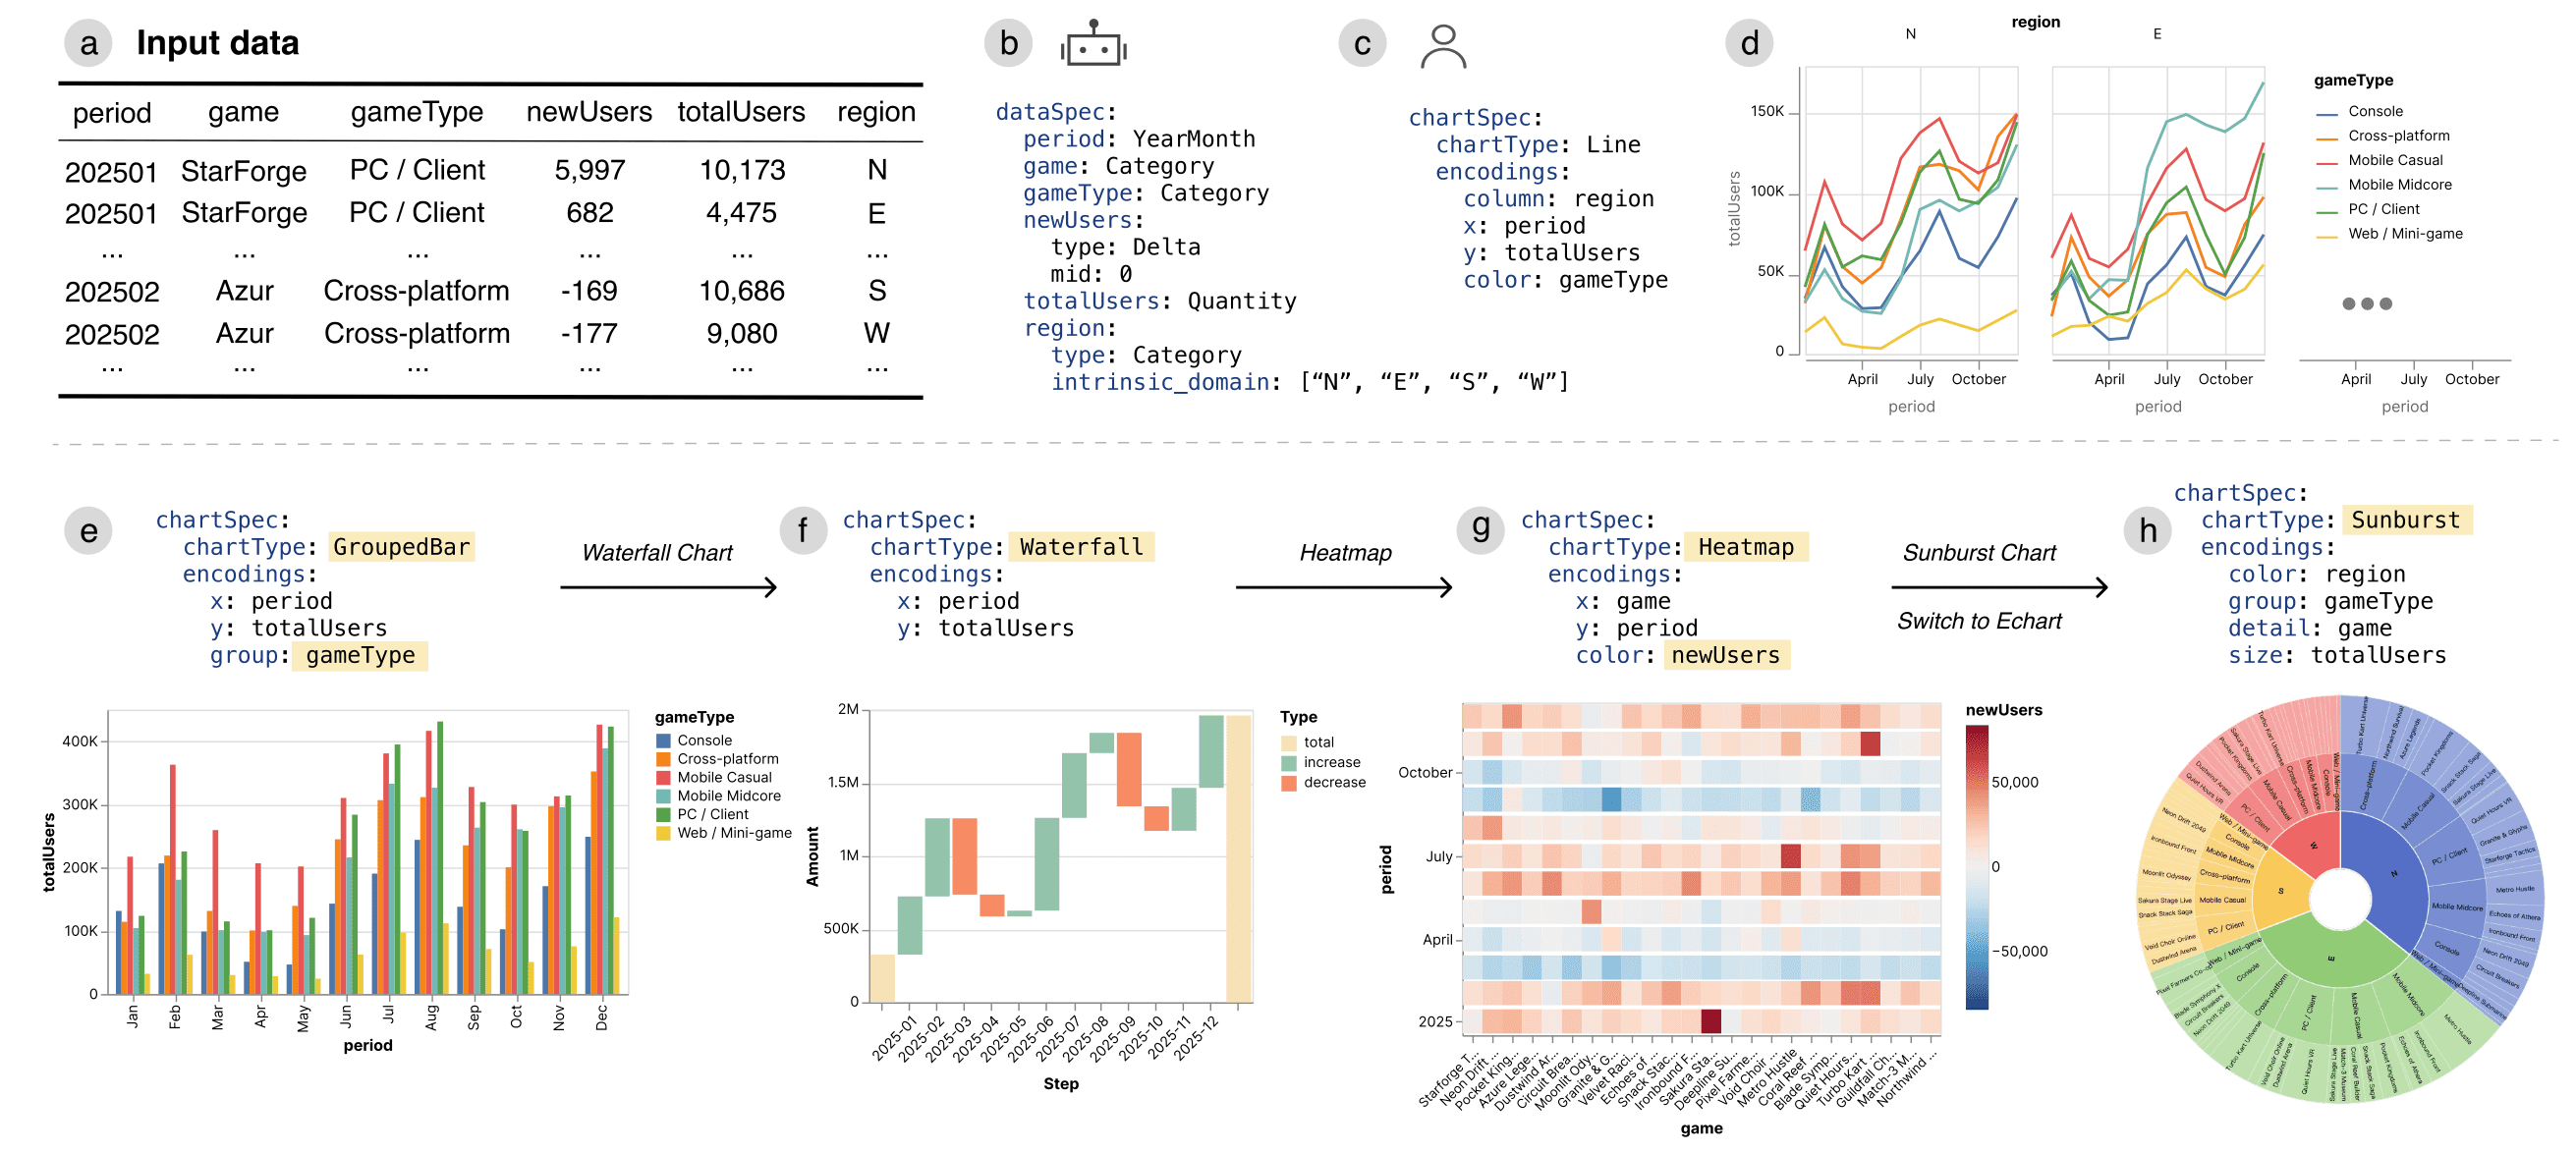
Figure 1: From data meaning and chart intent to multiple rendering libraries.
Abstract (Summary)
Flint lets authors describe the meaning of their data and the chart they want, while a compiler determines detailed visual settings. Its hierarchical description of data semantics guides decisions that would otherwise require manual configuration. The compilation pipeline refines an intermediate representation and emits runnable specifications for Vega-Lite, ECharts, or Chart.js. The project explores this common representation as a bridge for both people and language-model agents creating charts.
Links
Figures
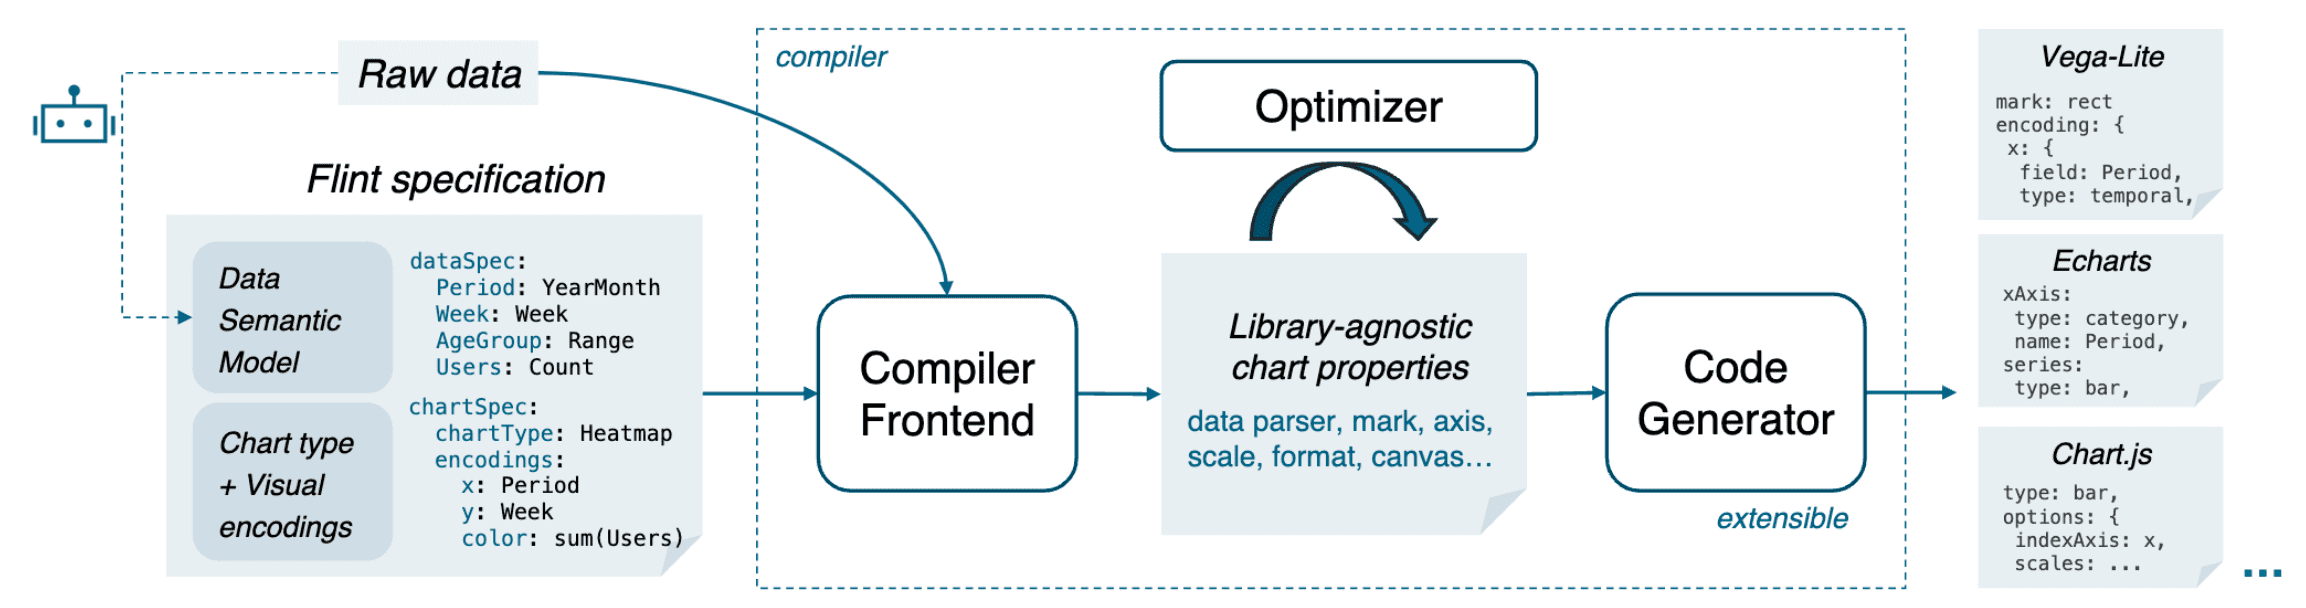
Figure 2: Compiler stages and support for different output libraries.
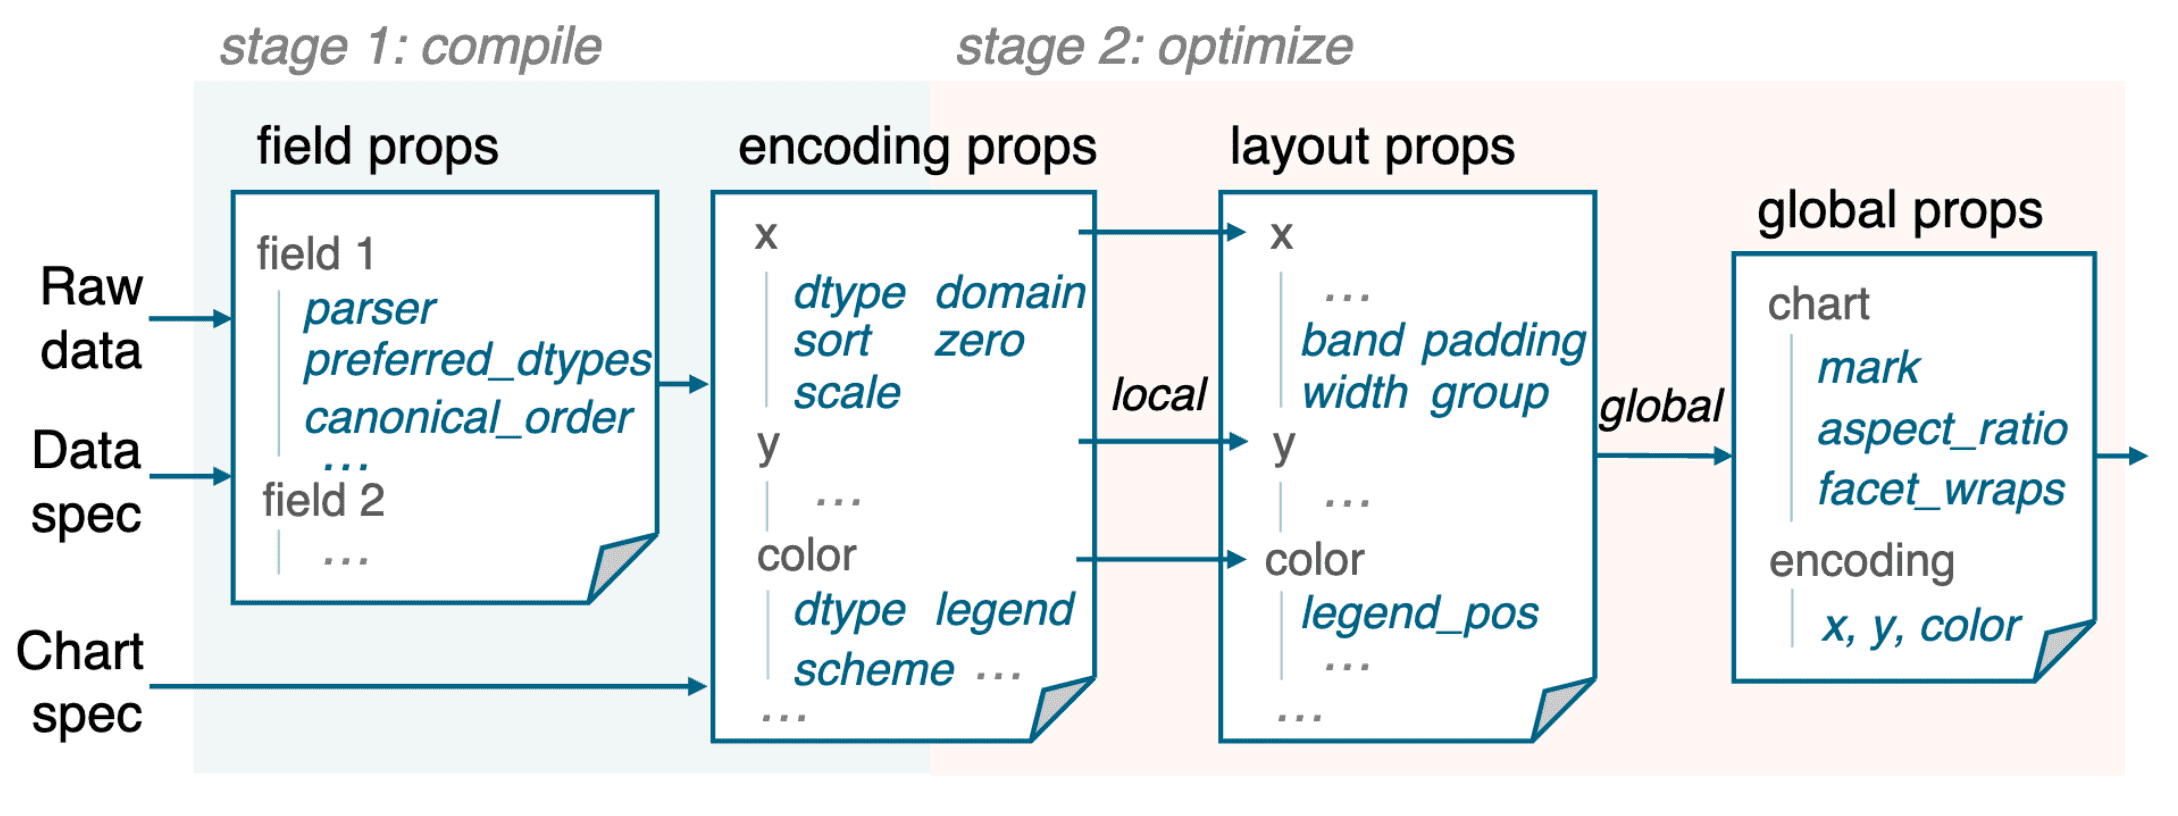
Figure 3: Refining intermediate properties into chart configurations.
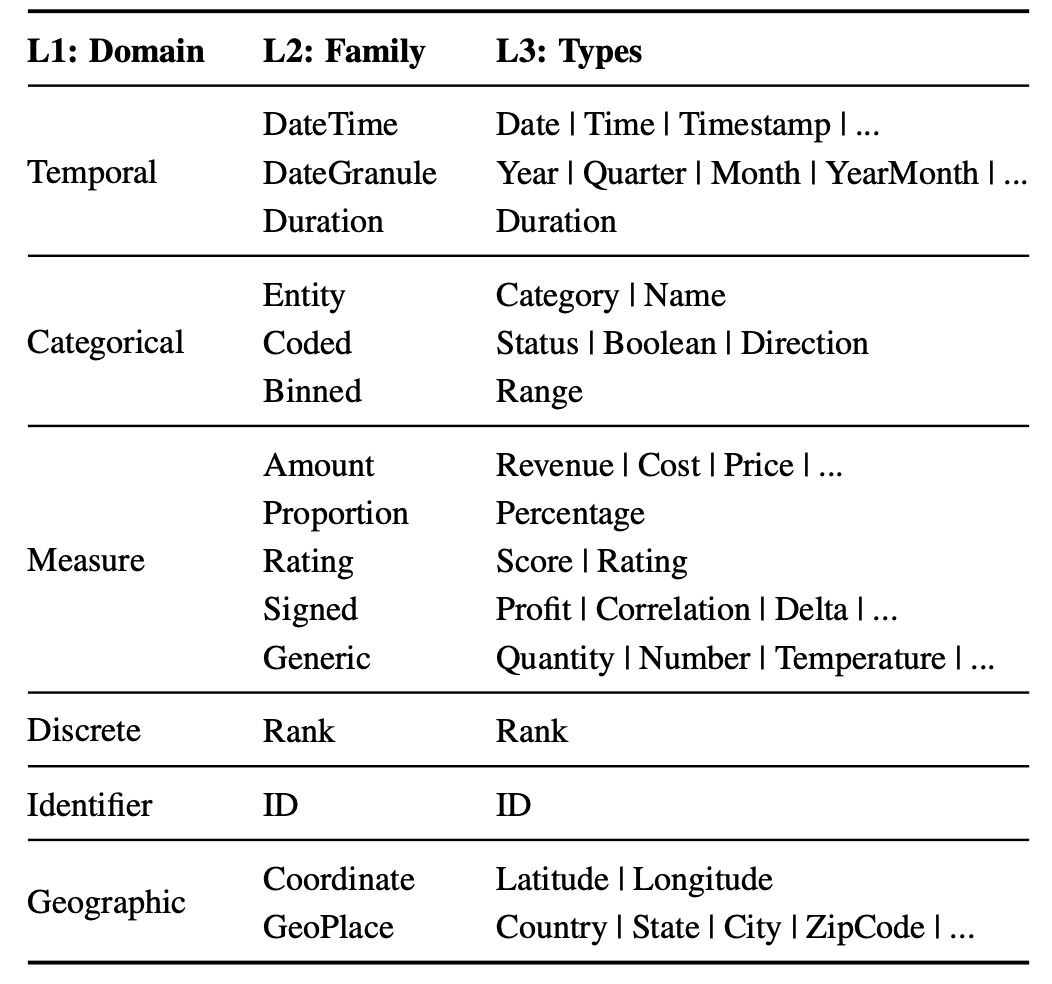
Figure 4: Examples of hierarchical data meanings.