Graph Evidential Learning for Anomaly Detection
Chunyu Wei*, Wenji Hu*, Xingjia Hao*, Yunhai Wang*, Yueguo Chen, Bing Bai, Fei WangFigure 1: Introducing Uncertainty for anomaly detection.Relying on reconstruction error, nodes 3 and 4 in the graph are misclassified without introducing uncertainty.
Abstract
While existing visualization libraries enable the reuse, extension, and combination of static visualizations, achieving the same for interactions remains nearly impossible.
Therefore, we contribute an interaction model and its implementation to achieve this goal. Our model enables the creation of interactions that support direct manipulation, enforce software modularity by clearly separating visualizations from interactions, and ensure compatibility with existing visualization systems.
Interaction management is achieved through an instrument that receives events from the view, dispatches these events to graphical layers containing objects, and then triggers actions.
We present a JavaScript prototype implementation of our model called Libra, enabling the specification of interactions for visualizations created by different libraries.
We demonstrate the effectiveness of Libra by describing and generating a wide range of existing interaction techniques. We evaluate Libra.js through diverse examples, a metric-based notation comparison, and a performance benchmark analysis.
Links
- The code is available on https://github.com/GEL0208/GEL.
Methodology
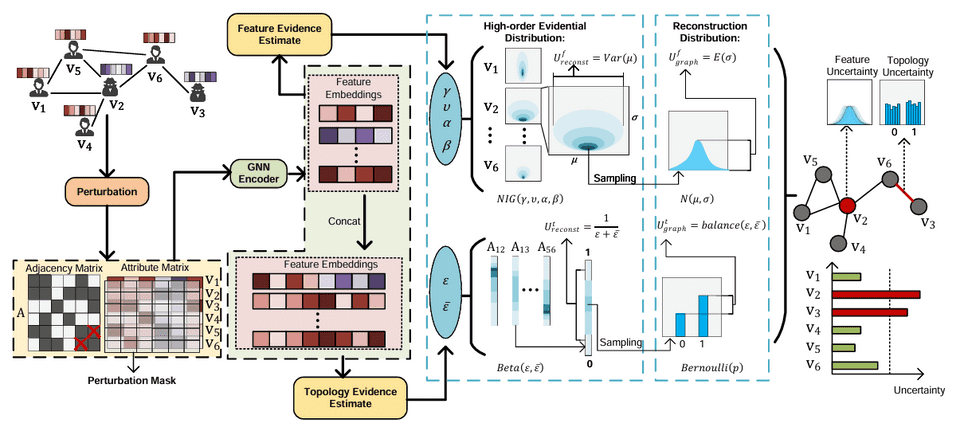
Figure 2: The overview of the GEL framwork. GEL models high-order evidential distribution to calculate feature uncertainty and topology uncertainty during the graph reconstruction process, leveraging these uncertainties for anomaly detection.
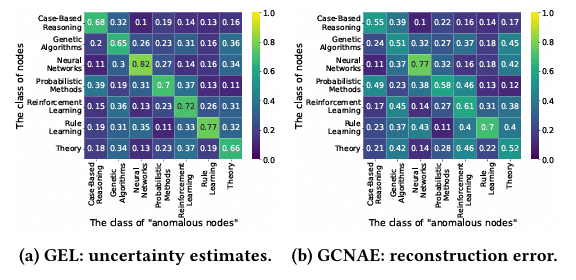
Figure 3: Heatmaps of average normalized anomaly scores on the Cora dataset. Rows correspond to the class omitted during training (anomalous class), columns represent the class labels during testing.
Experiments
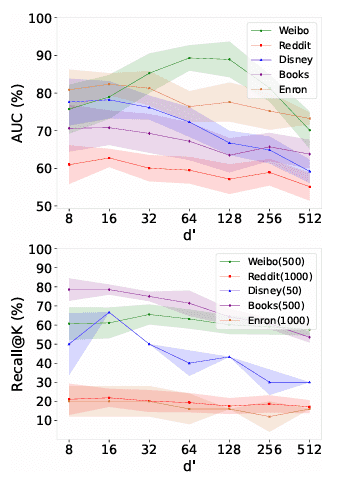
Figure 4: Impact of hidden layer dimension.
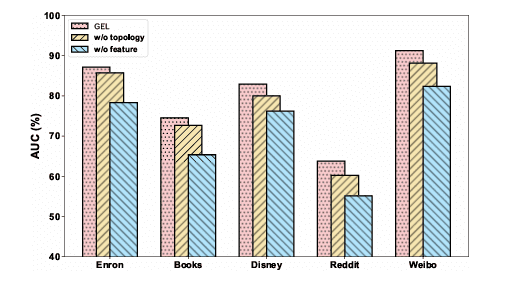
Figure 5: Impact of removing Different Modality.
Figure 6: Changes of AUC and Recall@K as the level of data disturbance increases.
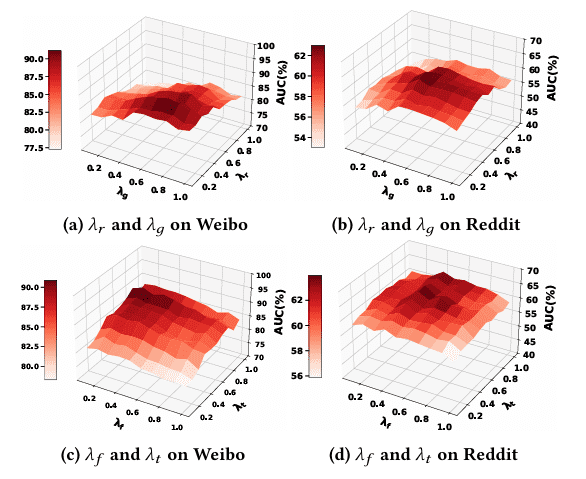
Figure 7: Impacts of weights on diverse uncertainty.

