OM3 : An Ordered Multi-level Min-Max Representation for Interactive Progressive Visualization of Time Series
Yunhai Wang, Yuchun Wang, Xin Chen, Yue Zhao, Fan Zhang, Chi-Wing Fu, Eugene Wu, Xiaohui YuAbstract
In this paper, We present a novel multi-level representation of time series called OM3 that facilitates efficient interactive progressive visualization of large data stored in a database and supports various interactions such as resizing, panning, zooming, and visual query. Based on our proposed line-segment aggregation, this representation can produce error-free line visualizations that preserve the shape of a time series in windows of arbitrary sizes. To reduce the interaction latency, we develop an incremental tree-based query strategy to support progressive visualizations, allowing a finer control on the accuracy-time tradeoff. We quantitatively compare OM3 with state-of-the-art methods, including a method implemented on a leading time-series database InfluxDB, in two settings with databases residing either in the local area network or on the cloud. Results show that OM3 maintains a low latency within 300 ms on the web browser and a high data reduction ratio regardless of the data size (ranging from millions to billions of records), achieving around 1,000 times faster than the state-of-the-art methods on the largest dataset experimented with.
Results
Figure 1: : Our OM3 -based architecture for interactive progressive error-free visualization of time series stored.
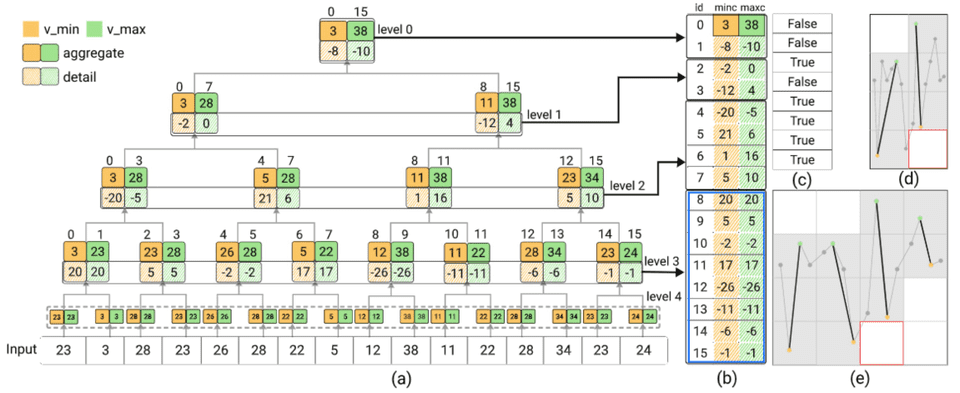
Figure 2: : Illustrating the OM3 forward transform and the coefficients stored in the database. (a) The input data (bottom) with 16 samples is recursively transformed to build the four-level coefficient tree. Each tree node has two aggregate coefficients and two associated detail coefficients. To start, we replicate the input data twice to construct the coefficients at level 4, marked by the dotted box. (b) The initial database table stores the final two aggregate coefficients at the top (level 0) and all detail coefficients from the forward transforms; detail coefficients that are redundant for reconstructing the original data are marked by the blue box. (c) The additional database table stores all ordering coefficients. (d,e) Line visualizations (in black) reconstructed by the inverse transform from the aggregate coefficients on a two-pixel-wide window (d) and a four-pixel-wide window (e), where the pixels with the red boxes are missed
Figure 3: Illustrating how incremental tree-based query supports for accurately visualizing a time series on a three-pixel-width window. (a) Simply generating the visualization by using four groups of the aggregate values at the level 2 could easily miss pixels (red boxes). (b,c) Our query method with pruning can efficiently visit necessary nodes in the OM3 coefficient tree to locate the minimum and maximum aggregates for each pixel column in the target window level by level and uses these value ranges to rasterize the pixel columns in (c). (d) The final visualization produced by our method (grey pixels) is error-free; its rasterization precisely matches the data points in the original line chart. Here, the detail coefficients of the node [14,17] do not need to be loaded, since its value range is covered by the value ranges of the adjacent two pixel columns [7,20] and [6,29], while the inter-column line highlighted in (d) corresponds to the node [14,22].
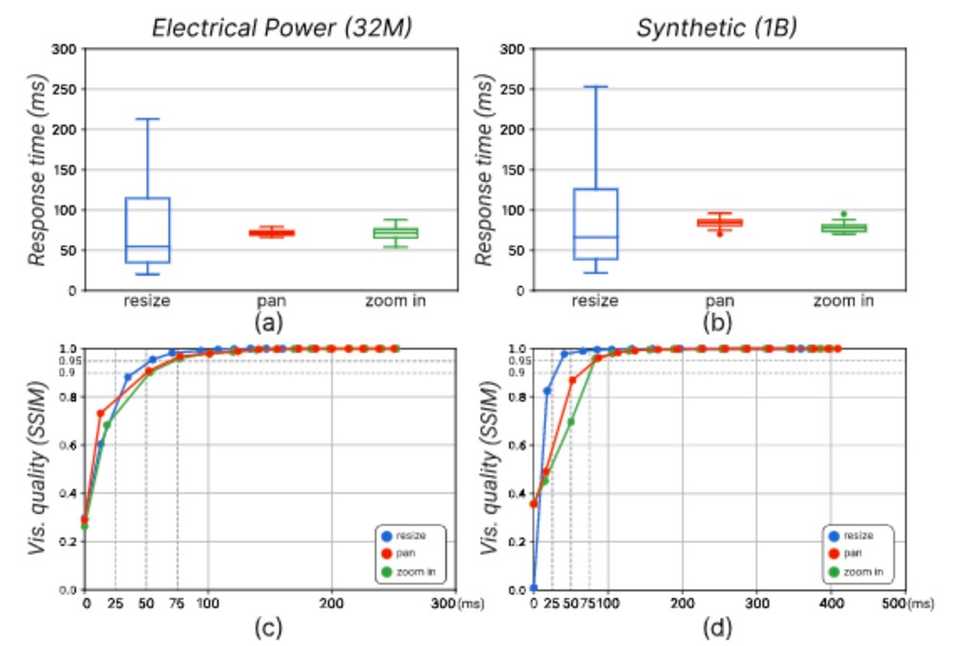
Figure 4: : (a,b) Boxplots summarize the response time of 20 trials for producing visualizations with SSIM values larger than 0.95 after performing three interactions on the two datasets. (c,d) The line charts show how SSIM-based visualization quality evolve over the response time for a randomly selected trial for each interaction on the two data.
Acknowledgements
The authors would like to thank the fruitful discussions with Dominik Moritz and André Kohn. This work was supported by the grants of the National Key R&D Program of China (2022ZD0160805), NSFC (No. 62132017, 62141217), NSERC, and NSF (No. 1845638, 2008295, 2106197, 2103794), as well as Amazon and Adobe.


